


December 4, 2020
Last spring, the word that kept coming to mind amid the COVID-19 disruptions was surreal. Things seemed so unbelievable that one had to ask, Is this real? Is this actually happening? Or is it a dream?
Now, after months of disruptions, the sense of “surreality” has rubbed off. We have become accustomed to the abnormal as our “new normal.” In a healthy way, our thoughts have shifted from questioning realities to determining how best to address them.
With a protracted back-to-school season this fall, multiple instructional models (remote, in-person, hybrid) in place, and sudden transitions back to all-virtual services in some districts, the 2020–2021 school year remains in tremendous flux. Questions have abounded, particularly around assessment. Should we still screen students with interim assessments? Can we administer them remotely? If we test remotely, does that impact our data? Are norms being updated? How do we compare growth and progress this school year to growth and progress in previous, “normal” years? How can we gauge the extent of the “COVID Slide”? What do we do about it?
In general, educators set very high bars for themselves. They strive to make everything as perfect as it can be, even as conditions work against them. This can create a lot of pressure, and we need to be realistic about just how perfect things can be when we’re working in far-from-perfect conditions.
Making the most of educational data this school year
If it has not dawned on you already, let me point out that we are currently living in a footnote of history. Ten, twenty, and even fifty years from now, when people look back at longitudinal student data from this period, there will always be an asterisk or footnote to remind them that the data and results must be considered through the lens of the disruptions caused by COVID-19. These are imperfect times, and all results from this period must be considered through that lens.
And it’s not just that data will need to be considered relative to our current conditions. In some cases, there will be an absolute void—in other words, no data to consider. Think, for example, of the longitudinal data void created by the cancellation of summative tests last spring. There will never be any state-level summative data for the 2019–2020 school year. Given that most accountability models also consider student growth, states are now wrestling with what the absence of 2019–2020 data means about growth scores moving forward. Depending on the growth model used, one year of missing performance data could create multiple years of missing growth data.
How do we fill this void?
With the absence of normative data coming from summative tests, interim assessments are filling the gap. We may not have state test data, but stakeholders are still concerned about gauging students’ learning loss. Interim assessments’ normative scores can address this question and help us to do a lot more. Schools still need to screen students for dyslexia, run their Response to Intervention (RTI) and Multi-tiered Systems of Support (MTSS) models, and disaggregate performance data to locate and address inequities.
Understanding the true impact of the “COVID Slide”
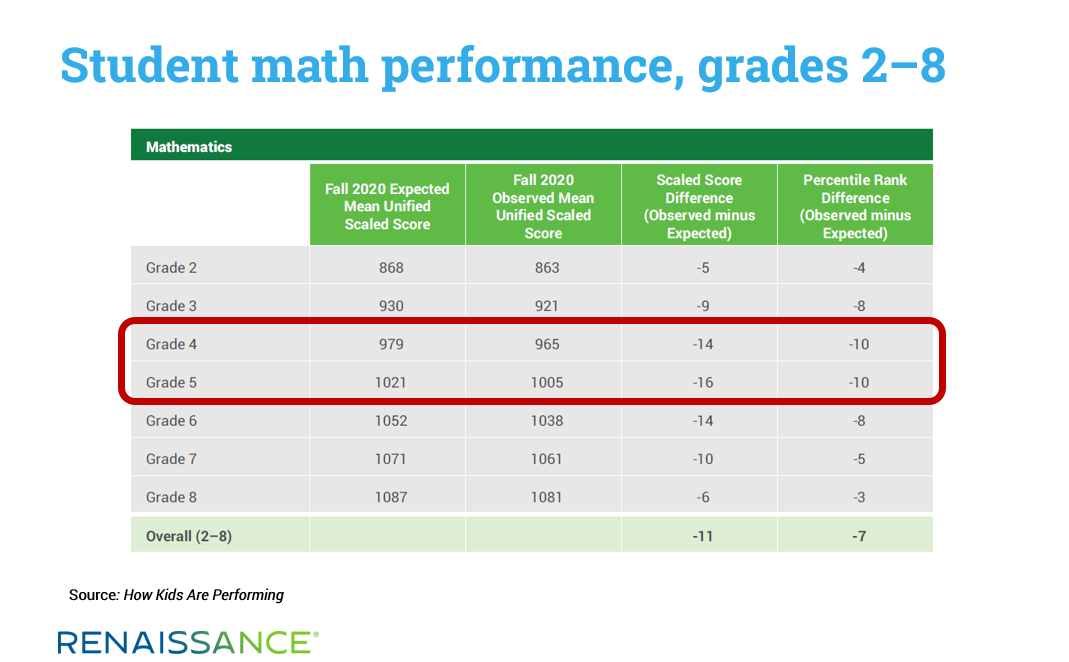
To support schools while they are “in the footnote,” Renaissance recently released the largest national longitudinal study targeted specifically at gauging the COVID-19-related academic disruptions. The How Kids Are Performing report looks at the back-to-school reading and mathematics performance of millions of students across all 50 states and the District of Columbia. Overall, the report shows mathematics performance has been significantly more impacted than reading performance, with grades 4 and 5 taking the largest hits.
The report does two major things. First, it offers new insights around the actual scope of the “COVID Slide.” While several reports targeting COVID-19 learning loss have been released, some of them as far back as April, all of these were either much smaller in scope (e.g., involved data from only a handful of states) or were simply predictions based on historical data and a variety of assumptions. According to Paul von Hippel at the University of Texas, most of the previous reports were, in this sense, “statistically informed guesses” (Barnum, 2020).
Such predictive approaches were the only viable ones early “in the footnote.” Megan Kuhfeld, a co-author of one of the earliest and more widely circulated predictive reports, noted that these reports “took on a life of their own” and were “sometimes spoken about with far more confidence than we have in them as researchers” (Barnum, 2020). Now, with actual fall 2020 assessment data available, we can move from making guesses and predictions about the COVID Slide to definitively quantifying its impact.
Second, the report offers a reference point for schools and districts trying to contextualize what they see in their own data. Thought leaders in the assessment community have been somewhat divided in their guidance on which tools best fit our current situation. While the value of formative assessment tools has consistently been upheld, some have questioned the use of more formal assessments. Despite some indecision on the part of thought leaders, the vast majority of schools have continued to administer their typical interim assessments. They recognize the need for the information these assessments provide.
With back-to-school assessment results now in hand, school leaders are looking for a way to compare what they are seeing in their own data with what is happening nationwide. Are our dips on par with the dips seen by others? Are the grades we are seeing as the most impacted the same as others are seeing? Are there particular ways that we should disaggregate our data to check for performance and equity gaps?
To aid in making comparisons, How Kids Are Performing includes the following, using data from 5.3 million Star Assessments administered this fall:
- Information on changes in student performance, expressed in terms of Percentile Rank (PR).
- Information on changes in student growth, expressed using Student Growth Percentile (SGP).
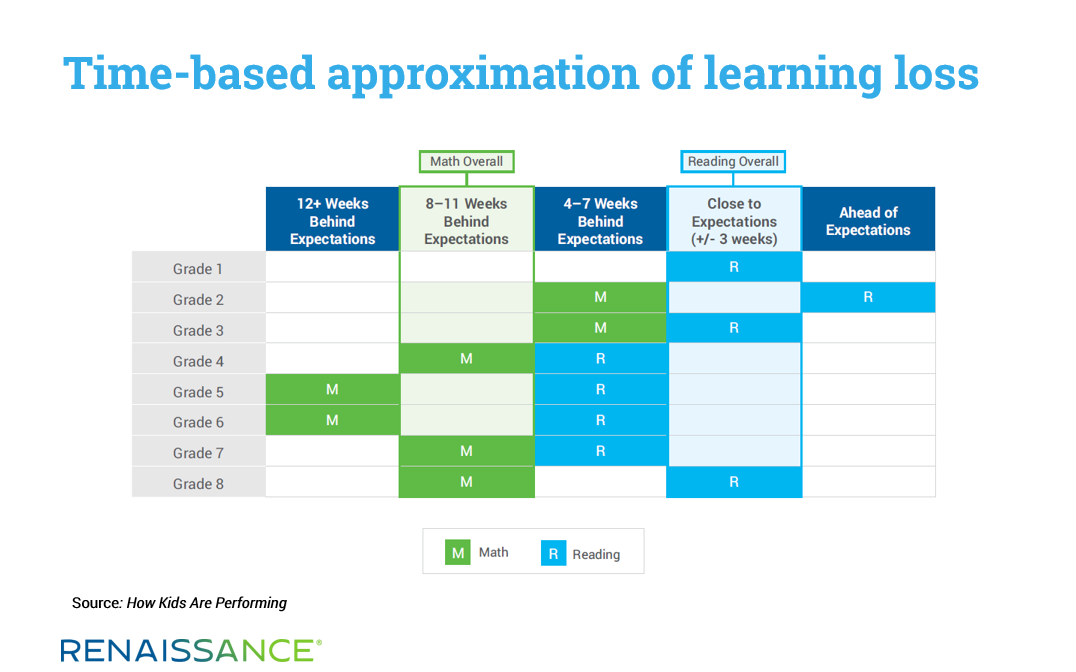
- A time-based approximation of learning loss (e.g., “These grades started the school year 8–11 weeks behind expectations”—see the the graphic below).
- A disaggregation of various factors by key demographics, including Free-Reduced Lunch, ELL status, Special Education status, Race/Ethnicity, school location (urban vs. rural), and school type (public vs. private/parochial).
While the new report offers many insights on the academic impacts of COVID-19 so far, an equally important consideration is how students grow and progress during the current academic year. Beginning with gaps of various sizes is one thing; seeing those gaps grow across the year is something else. For this reason, we suggest ongoing progress monitoring throughout the year using a variety of formative and interim tools. We cannot afford for a challenging situation to get even worse.
Maximizing the impact of daily instruction
Renaissance’s mission, succinctly stated, is to accelerate learning for all. As a result, we believe that there’s no need for yet another report that simply frames and admires the COVID Slide. Educators need clear next steps. This is why our very first step last spring, well before any analysis of COVID-19 learning loss, was to make available an instructional planning tool that would help educators deal with any eventuality.
When our Focus Skills Resource Center went online in June, educators across the country were able to instantly see a detailed listing of the most essential skills for progression in reading and mathematics, based on their state’s standards of learning. Purposefully targeting these essential building blocks of understanding during instruction goes a long way toward mitigating the academic challenges presented by the COVID-19 disruptions.
But it doesn’t end there. In many senses, 2021 will be “The Year of Interim Assessment.” This makes sense, given the urgency in gauging and addressing learning loss. Formative classroom assessments can provide a great deal of guidance, but some of the questions we have will clearly require information that only normed tests can provide. We don’t have time to wait for our summative systems to go back online in the spring. Normed scores related to performance and growth can be provided by the best interim tools right now, so we can understand where our students are today—and how best to move learning forward.
References
Barnum, M. (2020). How much learning have students lost due to COVID? Projections are coming in, but it’s still hard to say. Retrieved from: https://www.chalkbeat.org/2020/10/6/21504195/covid-schools-learning-loss-projections-nwea-credo
Learn more
Ready for more insights on the “COVID Slide”? Download the new How Kids Are Performing report to see performance and growth data by grade level, demographic group, school locale, and much more.