


06/15/2017
As an educator, you’ve likely heard that John Hattie and his work on effect size have revolutionized education. But like many in our field, you may not be familiar with the origins of Hattie’s work and what makes it such a powerful tool for identifying effective teaching methods and strategies.
In this blog, I’ll delve into John Hattie’s effect size methodology and its relevance to education. I’ll also provide a word of caution to teachers when using Hattie’s research to improve student outcomes.

What is the John Hattie effect size?
Effect size is a simple way of quantifying the difference between two groups that has many advantages over the use of typical tests of statistical significance alone (e.g., t-tests). Effect size should be easy to calculate and understand, and it can be used with any outcome in education (and in other disciplines as well).
Education researcher John Hattie developed a method of synthesizing various influences according to their effect size in different meta-analyses. In his original study titled Visible Learning, he ranked 138 influences related to learning outcomes from very positive effects to very negative effects. Through further study, he later updated this list to cover 195 influences in his book, The Applicability of Visible Learning to Higher Education.
Through his research, Hattie found that the average effect size of all the interventions he studied was 0.40. He therefore decided to judge the success of influences relative to this “hinge point” to find an answer to the age-old question, What works best in education?
He currently bases his research on nearly 1,200 meta-analyses.
How was the John Hattie effect size developed?
Hattie created great interest in 2008 when he published Visible Learning. In the book, he compares the statistical measure of effect size to the impact of a variety of influences on students’ achievement, such as:
- Class size
- Holidays
- Feedback
- Learning strategies
Hattie’s study was designed as a “meta-meta-study” that collects, compares, and analyzes the findings of nearly 50,000 previous studies in education and brings the data together in a way that is readily comprehensible.
In 2012, Hattie published a follow-up book, Visible Learning for Teachers, which concentrated on the underlying story behind the data and provided many concrete and hands-on examples in the classroom. In many countries, Hattie’s findings have become an important part of a teacher’s professional development and guides schools in their prioritization of initiatives.
But how do educators make sense of the statistical practice of the “John Hattie effect size” that is so often cited in education publications, since it’s easy to become confused when reading this literature?
For example, if you’re reading a research paper and the specific program had an effect size of 0.35 (or 35% of a standard deviation), some questions you might ask include:
- What does this actually mean?
- Is this effect size large or small?
- Is this program worth pursuing?
The answers to these questions aren’t necessarily clear and simple in actual practice. They depend on many factors that can affect the quality of the studies in question, such as:
- Did the researchers use quality measures and tools to assess the impact of the program?
- Was the study very brief and/or artificial relative to actual classroom conditions?
- Was the sample size too small to generalize to the larger student population? (Savin 2013)
For this reason, it would behoove us to first define what the John Hattie effect size is and what it can reveal as a metric, and to then discover how to interpret the values and use them effectively to impact student outcomes.

How is the John Hattie effect size used in education?
One of the most commonly used scenarios for the John Hattie effect size is to determine the efficacy of an intervention or educational practice relative to a comparison group or approach. Not only does the John Hattie effect size indicate if an intervention will work, but it also predicts how much impact to expect in a range of scenarios.
The goal of the John Hattie effect size is to provide a measure of “the size of the effect” from the intervention rather than pure statistical significance, which tends to get confounded with effect size and sample size.
Hattie mentions the term “meta-analysis,” which is one of the most useful ways of using effect size. This refers to the process of synthesizing research results into a single effect size estimate. When the research has been replicated, the different effect size results from each study can be combined to give an overall best estimate of the size of the effect.
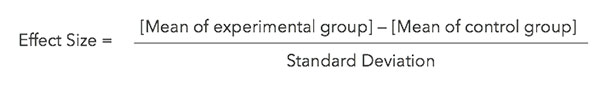
The calculation of the John Hattie effect size is actually quite simple and is the standardized mean difference between the two groups. It can be expressed as an equation:
This approach allows the researcher to look at various studies and, essentially, average the effect sizes across studies to derive a single metric—one that can predict how impactful an intervention or educational practice will be on specific student outcomes.
Effect size scores are equal to “z-scores” of a normal distribution and, thus, have the same possible range of scores. The John Hattie effect size scores will typically range from about -2.0 to 2.0, but could range from +/- infinity as the normal curve never touches the baseline. In theory, you could have many standard deviations above or below the average. Generally, John Hattie effect sizes range from -0.5 to 1.75 in most educational contexts.
Insights to move learning forward
Discover solutions from Renaissance to improve outcomes for all learners.
How to interpret effect size values
Jacob Cohen, an American statistician and psychologist who was renowned for his work on statistical power and effect size, described a basic method for interpreting effect size as follows:
- 0.20 as small
- 0.50 as medium
- 0.80 as large
Ever since, these values have been widely cited as the standard for assessing the magnitude of the effects found in intervention research. However, Cohen cautions us about their appropriateness for such general use. Many people consider John Hattie effect sizes of:
- 0.3 or less to indicate a small impact on outcomes
- 0.4 to 0.6 to represent moderate treatment effects; and
- 0.70 or greater to indicate highly effective treatments
Certainly, we can deduce that the higher the John Hattie effect size is, the greater the expected magnitude of the effect will be on student outcomes.
For example, a John Hattie effect size of 0.7 means that the score of the average student in the intervention group is 0.7 standard deviations higher than the average student in the “control” group. In other words, it exceeds the scores of 69% of the similar group of students who did not receive the intervention.
Tying this statistical discourse to the classroom, Hattie published his latest meta-analyses and reported the interventions and educational practices that are most effective, based on his meta-analyses of 1,200 studies. The following chart displays all of the John Hattie effect sizes larger than 0.70, as detailed in his 2016 book Visible Learning for Literacy:
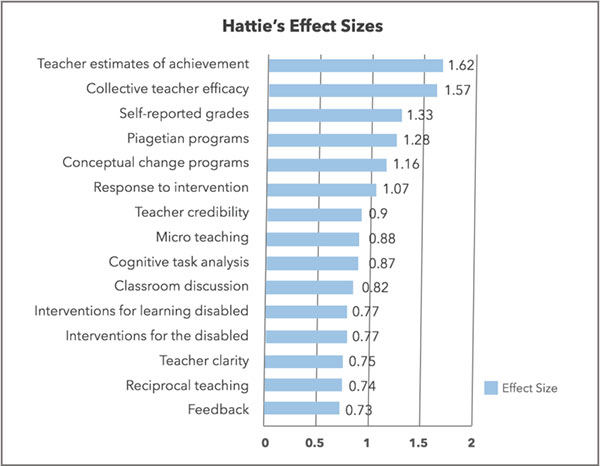
From these results, we can determine, for example, that Response to Invention systems produced a 1.07 standard deviation greater impact on student outcomes (higher test scores) than districts not implementing RtI approaches.
Furthermore, Hattie has identified what he terms the “super factors” affecting student outcomes:
Teacher estimates of achievement (Effect size = 1.62). Unfortunately, this reflects the accuracy of a teacher’s knowledge of their students and not “teacher expectations.” Therefore, this is not a factor teachers can use to boost student achievement.
Collective teacher efficacy (Effect size = 1.57). This factor involves helping all teachers on the staff to understand that the way they do their work on a day-to-day basis has a significant impact on student performance. This also means that teachers should not use distal factors such as a student’s home life, socio-economic status, or motivation as reasons for poor achievement. Great teachers will try to make a difference despite these inhibitory factors.
Self-reported grades (Effect size = 1.33). This factor reflects the fact that students are quite aware and capable of anticipating their grades before receiving their report cards. But this is not something teachers can truly use to boost performance.
Piagetian levels (Effect size = 1.28). This is another super factor on which teachers have little or no influence. Students who were assessed as being at a higher Piagetian level than other students perform better at school. The research does not suggest that trying to boost students’ Piagetian levels has any effect, however.
Conceptual change programs (Effect size = 1.16). This research refers to the type of textbook used by secondary science students. While some textbooks simply introduce new concepts, conceptual change textbooks simultaneously introduce concepts and discuss relevant and common misconceptions that can hinder deeper levels of student learning.
While the current research is limited to science textbooks in secondary school, it’s reasonable to predict that when teachers apply this same idea to introduce any new concept in their classroom, it could have a similar positive impact.
Response to Intervention (Effect size = 1.07). There are plenty of resources available to help schools use an RtI or multi-tier system of support (MTSS) framework effectively. RtI and MTSS involve screening students to see who is at-risk, deciding whether supporting intervention will be given in-class or out-of-class, using research-based teaching strategies within the chosen intervention setting, closely monitoring students’ progress, and adjusting the strategies being used when enough progress is not made.
While these frameworks are often designed for at-risk students, the underlying principles are the same as those advocated by Hattie as being applicable to all students.

A word of caution when using effect size research
Although the use of the John Hattie effect size has produced much conversation and innovation in education, there are some caveats to which educators must attend. According to Coe (2002), care must be taken with respect to interpreting effect size for educational programs and interventions.
The word “effect” often connotes or implies “causality.” In many cases, there is an identified relationship, but the word “effect” should be used only when it can be justified.
We must also be careful when comparing or aggregating John Hattie effect sizes when there are:
- Different operationalizations of the same outcome.
- Clearly different treatments.
- Measures derived from different student populations.
- Different levels of the same intervention applied.
Renaissance: Providing researched-based solutions to improve student outcomes
If you’re looking for tools and strategies to improve learning outcomes in your school or district, Renaissance can help. We offer research-based assessment, instruction, and practice solutions designed to help you:
- Identify students’ needs in reading, math, and social-emotional behavior
- Engage students in targeted instruction and practice at the just-right level
- Boost the effectiveness of RtI and MTSS frameworks
- Provide all stakeholders with ongoing insights into student progress and growth
Learn more
Connect with an expert today to learn how Renaissance solutions can help you to put research into action to support greater student growth.

Sources
Coe, R. (2002). It’s the effect size, stupid: What effect size is and why it is important. Paper presented at the Annual Conference of the British Educational Research Association.
Cohen, J. (1990). Things I have learned (so far). American Psychologist, 45(12), 1304–1312.
Lipsey, M., et al. (2012). Translating the statistical representation of the effects of education interventions into more readily interpretable forms. US Department of Education.
Hattie, J. (2008). Visible learning: A synthesis of over 800 meta-analyses relating to achievement. New York: Routledge.
Hattie, J. (2012). Visible learning for teachers: Maximizing impact on learning. New York: Routledge.
Hattie, J., et al. (2016). Visible learning for literacy, grades K–12: Implementing the practices that work best to accelerate student learning. Thousand Oaks: Corwin.
Savin, R. (2013). Effect size matters in educational research. Retrieved from: https://www.edweek.org/education/opinion-effect-size-matters-in-educational-research/2013/01