Assessing student growth with the interactive Growth Proficiency Chart
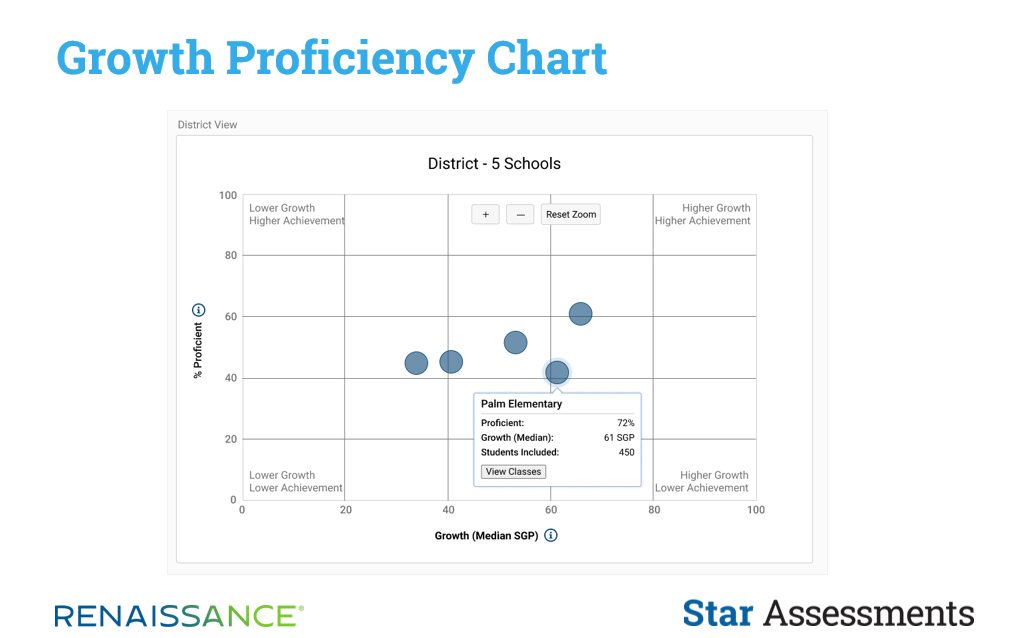
Get deeper insight into your students’ achievement and growth with the reimagined Renaissance Growth Proficiency Chart available for Star Early Literacy, Star Reading, and Star Math (English and Spanish).
The interactive Growth Proficiency Chart visually displays data to show the relationship between proficiency and growth, based on the most recent Star Assessment taken. As you view the chart, you can see—at a glance—which students, classes, or schools show the following:
- Low proficiency, low growth
- Low proficiency, high growth
- High proficiency, low growth
- High proficiency, high growth
You define proficiency by choosing the benchmark you’d like to use (state, district, or school). Growth is expressed using Student Growth Percentile (SGP) scores. You’ll be able to quickly identify if low-performing students are experiencing high growth rates or, conversely, if high-performing students’ growth is stagnating. This data, which is shown on an easy-to-read dashboard, helps you determine best next steps for all of your students.

Please note:
- SGP scores are not available for Star Reading and Star Math assessments in Spanish for grades 9–12.
- The state proficiency benchmark option is not available for any Star assessment in Spanish, regardless of grade level.
