


October 14, 2020
Last spring, school buildings had barely gone dark before questions about potential learning loss began to appear. The title of an Education Week article from early April read, “How Schools Will Overcome the ‘Coronavirus Slide:’ Ideas from Five Superintendents.” This was perhaps a follow-up to an article in the previous week’s issue that asked, “Will Learning Gaps Deepen as Schools Stay Closed?” It’s probably worth asking ourselves a question here: Do we remember our own thinking back in early April, and our expectations for when school might get back to normal?
An article in the Hechinger Report from the same time period expressed the odd idea that “students may not return to school this [academic] year.” In early April, the idea that large numbers of students would not return to their buildings by the end of the school year seemed unrealistic. Yet as the weeks progressed, we began to accept that the disruptions might continue for longer than we’d initially thought. But students would surely return to buildings en masse in the fall, right?
Once we realized how protracted the disruptions would be, projections about the scale of possible learning loss began to appear. Matt Barnum sought insight from the long-term school closures in Argentina due to teacher strikes in the 1980s and 90s. The total amount of time that students were away from school was similar to our COVID-related disruptions, but, in Argentina, the school closures were spread over multiple years. Another difference: online learning. David Jaume, who co-authored an extensive report documenting the impacts on Argentinian students, told Barnum that “the situation today is much different,” because schools now “have online learning [that] would at least mute part of the negative results.”
The most widely circulated projections about “COVID-19 Slide” came from two reports, one published by NWEA and the other by FastBridge, which relied on data about summer learning loss. This raises an obvious question: To what extent did last spring’s school closures truly parallel a typical summer? In other words, was the entire time away from school buildings simply a longer period of “time off,” or did educators’ herculean efforts around distance learning help to mitigate the disruption? Despite this nuance, other organizations have been quick to jump on the learning-loss bandwagon. One recent webinar referred to today’s students as “the lost COVID-19 generation,” while a tutoring center warned of an “education crisis,” stating that “children may never recover the losses.”
What can we learn from these dramatic statements? Within the narrative about learning loss, some have clearly conflated projections or predictions about “COVID-19 Slide” with definitive documentation that it exists. For example, the title of a recent article is “Study shows major learning loss for grades K–2.” In fact, the work being profiled makes predictions about what might occur by relying upon historical “summer slide” data. In a sense, the study does not definitively “show” anything. Instead, it offers projections based, essentially, on treating last spring’s disruptions like a very long summer break. To the extent that the dynamics of spring 2020 were not like a typical summer, these projections could be significantly off.
Because last spring’s school closures were truly unprecedented—unlike summer vacation, unlike the disruption to schooling in Argentina, unlike anything—Renaissance shied away from making projections about how students would perform this fall. We are, however, quickly moving into a new period where projections are no longer necessary.
From prediction…to reality
As schools across the country begin the 2020–2021 year—whether face-to-face, remotely, or in a hybrid/blended environment—a new period begins where we can document the realities of “COVID-19 Slide” by analyzing actual fall assessment data. We will no longer be dealing with unknowns and predictions. Instead, the realities will be before us. Questions of particular interest include:
- How does student performance in Fall 2020 compare to expected or typical performance by subject and grade level?
- Is there a greater spread/range in scores overall?
- Are particular grades and/or subject areas impacted more than others?
- To what extent are particular demographic subgroups impacted?
- Are there variances between schools in more rural areas and more urban areas—as some have suggested, given that internet access varies considerably?
As one of the largest assessment providers in the world, typically supporting over 80 million administrations of Star Assessments each school year, Renaissance is uniquely positioned to analyze back-to-school data on a massive scale in order to help answer these questions. We’ll document our findings in a forthcoming report, to be titled How Kids Are Performing: Tracking the Impact of COVID-19 on Reading and Mathematics Achievement.
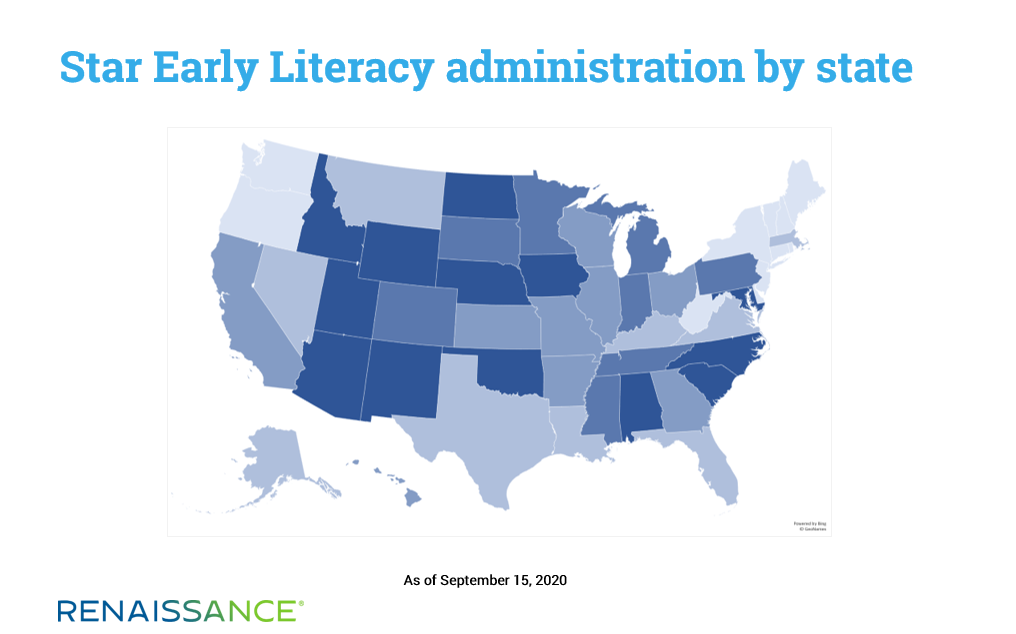
The analysis for this new report is well underway, and we can share some observations based on an initial data pull. As of September 15, more than 5 million Star Assessments (early literacy, reading, and math) had been administered in the new school year, with significant increases occurring each day. In terms of year-over-year (YoY) testing volume, Star Early Literacy experienced the most usage, likely due to its inclusion on multiple state-approved lists. Also, some states have taken the approach of having the youngest learners return to school buildings first, which may also drive higher usage of this assessment.
The following map shows usage of Star Early Literacy by state, as of September 15. In the states indicated by the darkest shade of blue, more than 80 percent of students YoY had tested. The lightest shade of blue reflects 20 percent or less of YoY testing volume.
There is, however, much more data to be collected, particularly for reading and math. The following map shows YoY testing volume for Star Reading as of September 15, using the same color-coding. While the equivalent map for Star Math is not shown, it is virtually identical.
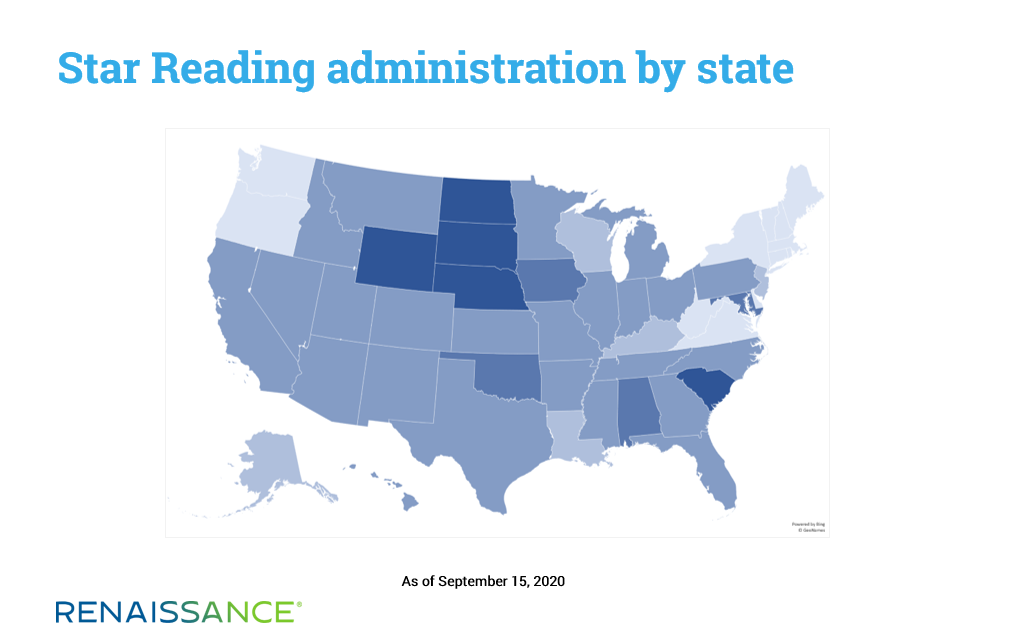
On this map, regional differences are a bit clearer. A handful of states in the upper Midwest that are generally rural in makeup lead the way in testing. The northeast—which has been hit particularly hard by the COVID-19 pandemic—trails noticeably. The large student populations in California, Florida, and Texas are only partially represented in this initial data set.
In spite of these limitations and the early stage of the analysis, are any broad findings beginning to emerge? Most importantly, is there evidence of a “COVID-19 Slide”? If so, has a particular subject area and/or grade level been more affected than others?
For our purposes here, we’ll provide a preliminary answer to these questions by focusing on reading in grades K–8 and on math in grades 1–8. These are the subject areas and grade levels where the largest data samples are available.
While there are some grade levels where YoY scores appear to be stable, more than half of all subject/grade combinations show lower normative performance in Fall 2020 compared to Fall 2019. The observed shortfalls for math are more numerous and more substantial than those for reading. Across both reading and math, grades 4 and 5 initially appear to be the most negatively impacted. Following is a breakdown of the results by subject area, as of September 15.
Student performance on Star Reading:
- We compared scores for nearly two million students who completed the assessment in both Fall 2019 and Fall 2020.
- We did not observe a significant COVID-19 decline.
- In Fall 2019, 52 percent of students were meeting benchmark (i.e., performing at grade level) in reading. In Fall 2020, this has declined to 51 percent.
- In Fall 2019, 31 percent of students were identified as needing intervention in reading. In Fall 2020, this has increased to 33 percent.
Student performance on Star Math:
- We compared scores for nearly one million students who completed the assessment in both Fall 2019 and Fall 2020.
- We observed some evidence of a COVID-19 decline.
- In Fall 2019, 65 percent of students were meeting benchmark in math. In Fall 2020, this has declined to 59 percent.
- In Fall 2019, 22 percent of students were identified as needing intervention. In Fall 2020, this has increased to 26 percent.
So, while there is some cause for initial concern with math, we would note that, so far, our data does not indicate a “lost generation” or dynamics from which students could “never recover,” as the dire predictions claim.
Finally, we would note that as important as it is to document how students are starting the school year, it will also be critical to document their growth during the year. Decreases that are marginal-to-moderate as the year begins are one thing, but if marginal-to-moderate declines are followed by below typical progress, then the situation becomes more serious. For this reason, we’ll release follow-up reports after the typical winter and spring screening periods to show how students are performing over the course of the year.
Renaissance will continue to collect and analyze fall screening data over the coming weeks, as long as a substantial number of Star tests are administered. We anticipate the release of the initial report in November, designed to answer educators’ most pressing questions about how students are performing this fall—and which students have been impacted the most by the COVID-related disruptions.
Ready for more insights on students’ performance this fall? Download your free copy of the new How Kids Are Performing report today.