


July 11, 2018
Have you ever been perplexed by a situation like this one?
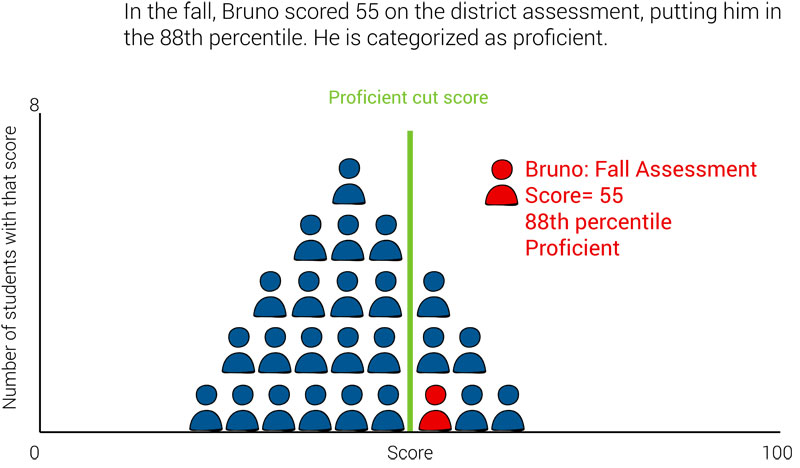
In the fall, a student named Bruno did well on a district assessment. He scored 55 out of 100, which the district considers “proficient” for his grade level. His percentile rank was 88, which puts him ahead of his peers.
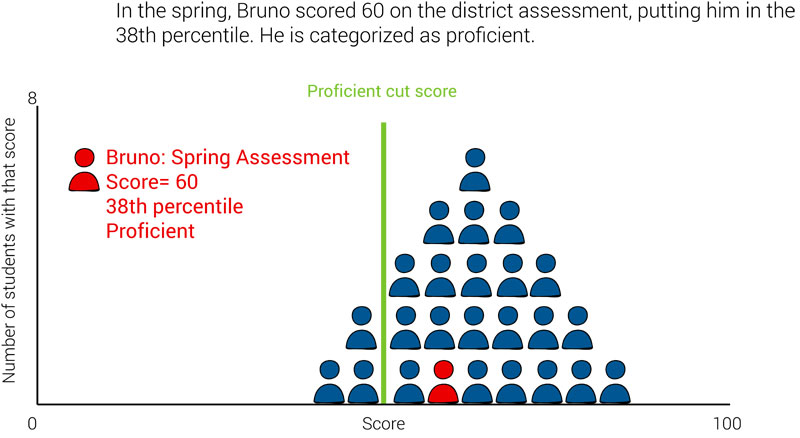
Later that school year, in the spring, Bruno took the same assessment again. This time he scored 60, still “proficient” for his grade, but suddenly his percentile rank has dropped to 38.
What happened? Bruno’s spring score of 60 is higher than his fall score of 55, but his percentile rank is lower, dropping from 88 in the fall all the way down to 38 in the spring. How is that even possible?
In this blog, we’ll take a closer look at criterion-referenced tests vs. norm-referenced tests and how the different score types can confuse even the experts.
Criterion-referenced vs. norm-referenced tests
To understand what happened, we need to understand the difference between criterion-referenced tests and norm-referenced tests.
The first thing to understand is that even an assessment expert couldn’t tell the difference between a criterion-referenced test and a norm-referenced test just by looking at them. The difference is actually in the scores—and some tests can provide both criterion-referenced results and norm-referenced results!
How to interpret criterion-referenced tests
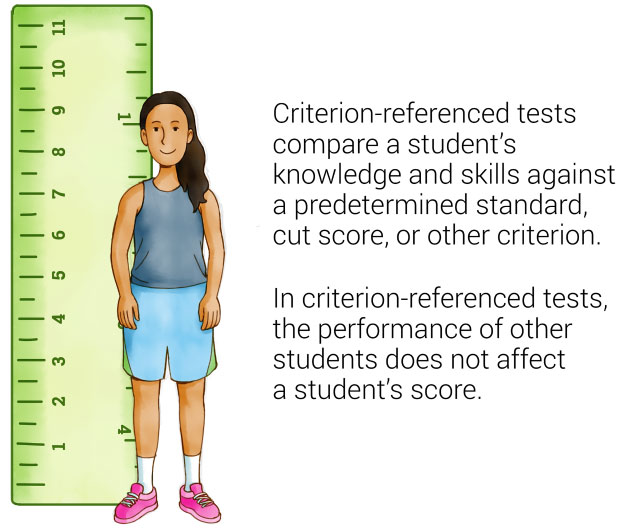
Criterion-referenced tests compare a person’s knowledge or skills against a predetermined standard, learning goal, performance level, or other criterion. With criterion-referenced tests, each person’s performance is compared directly to the standard, without considering how other students perform on the test. Criterion-referenced tests often use “cut scores” to place students into categories such as “basic,” “proficient,” and “advanced.”
Example of criterion-referenced measures
If you’ve ever been to a carnival or amusement park, think about the signs that read “You must be this tall to ride this ride!” with an arrow pointing to a specific line on a height chart. The line indicated by the arrow functions as the criterion; the ride operator compares each person’s height against it before allowing them to get on the ride.
Note that it doesn’t matter how many other people are in line or how tall or short they are; whether or not you’re allowed to get on the ride is determined solely by your height. Even if you’re the tallest person in line, if the top of your head doesn’t reach the line on the height chart, you can’t ride.
Criterion-referenced assessments work similarly: An individual’s score, and how that score is categorized, is not affected by the performance of other students.
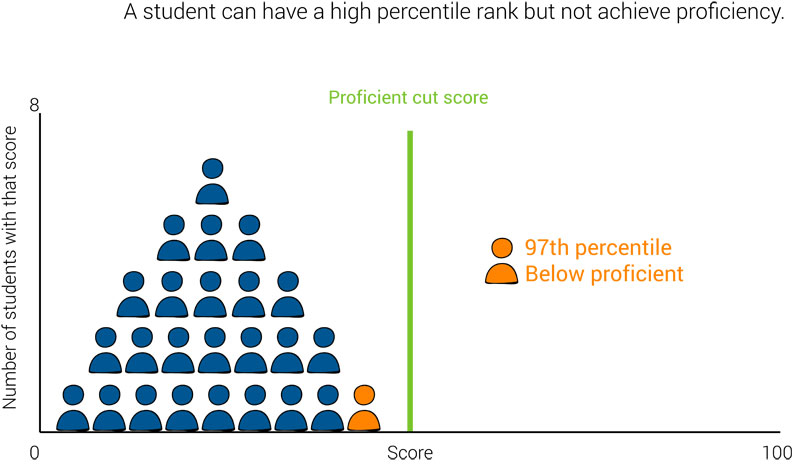
In the charts below, you can see the student’s score and performance category (“below proficient”) do not change, regardless of whether they are a top-performing student, in the middle, or a low-performing student.
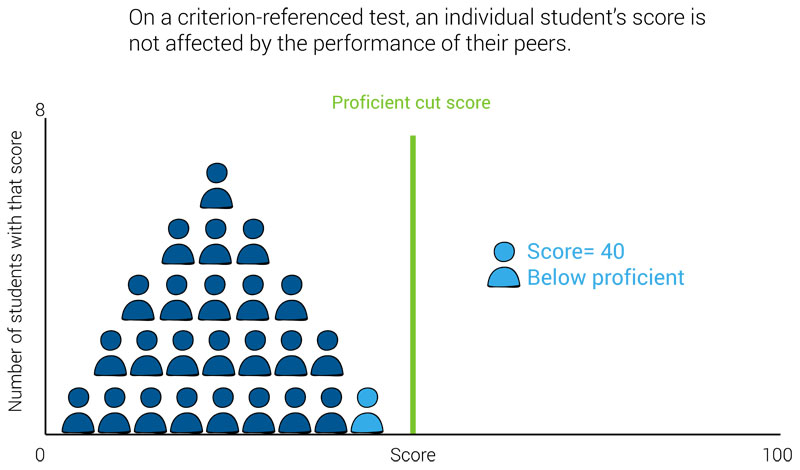
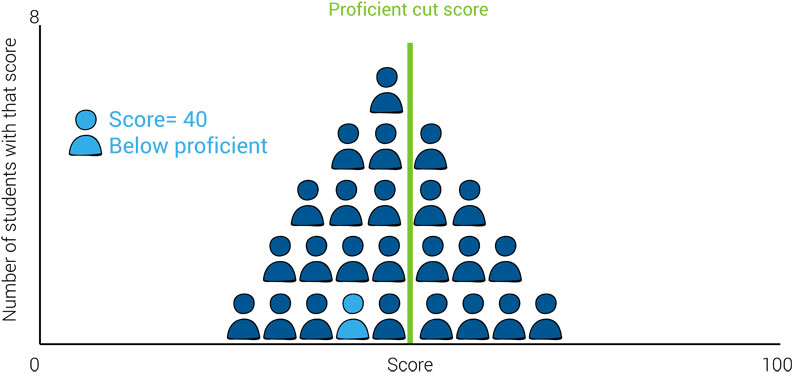
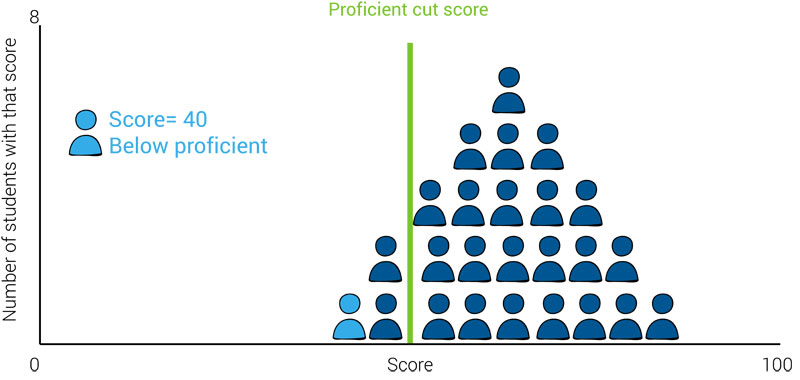
This means knowing a student’s score for a criterion-referenced test will only tell you how that specific student performed in relation to the criterion, but not whether they performed below-average, above-average, or average when compared to their peers.
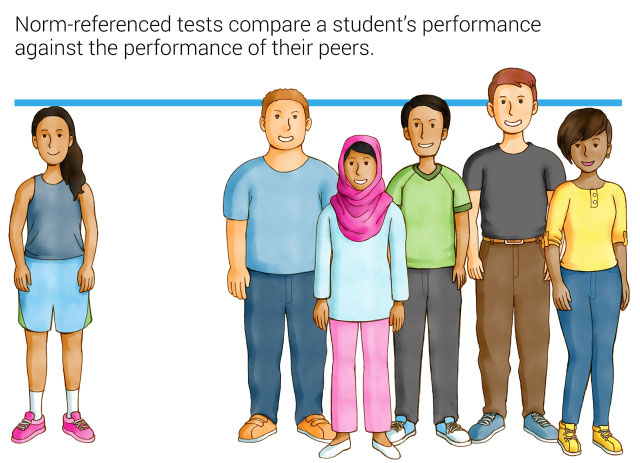
How to interpret norm-referenced tests
Norm-referenced measures compare a person’s knowledge or skills to the knowledge or skills of the norm group. The composition of the norm group depends on the assessment.
For student assessments, the norm group is often a nationally representative sample of several thousand students in the same grade (and sometimes, at the same point in the school year). Norm groups may also be further narrowed by age, English Language Learner (ELL) status, socioeconomic level, race/ethnicity, or many other characteristics.
Example of norm-referenced measures
One norm-referenced measure that many families are familiar with is the baby weight growth charts in the pediatrician’s office, which show which percentile a child’s weight falls in:
- A child in the 50th percentile has an average weight
- A child in the 75th percentile weighs more than 75% of the babies in the norm group and the same as or less than the heaviest 25% of babies in the norm group
- A child in the 25th percentile weighs more than 25% of the babies in the norm group and the same as or less than 75% of them.
It’s important to note that these norm-referenced measures do not say whether a baby’s birth weight is “healthy” or “unhealthy,” only how it compares with the norm group.
For example, a baby who weighed 2,600 grams at birth would be in the 7th percentile, weighing the same as or less than 93% of the babies in the norm group. However, despite the very low percentile, 2,600 grams is classified as a normal or healthy weight for babies born in the United States—a birth weight of 2,500 grams is the cut-off, or criterion, for a child to be considered low weight or at risk. (For the curious, 2,600 grams is about 5 pounds and 12 ounces.)
Thus, knowing a baby’s percentile rank for weight can tell you how they compare with their peers, but not if the baby’s weight is “healthy” or “unhealthy.”
Norm-referenced assessments work similarly: An individual student’s percentile rank describes their performance in comparison to the performance of students in the norm group, but does not indicate whether or not they met or exceed a specific standard or criterion.
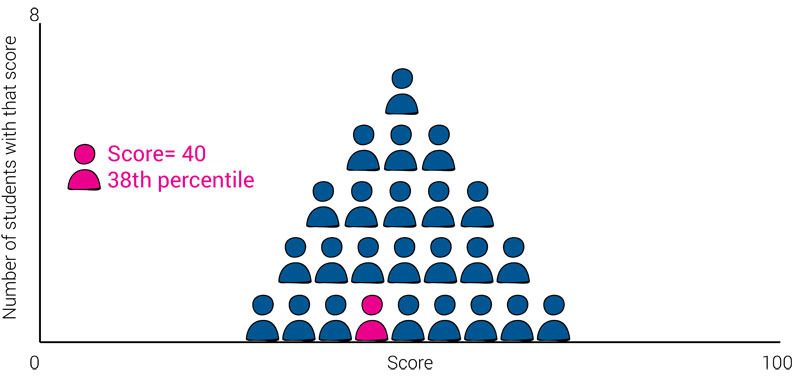
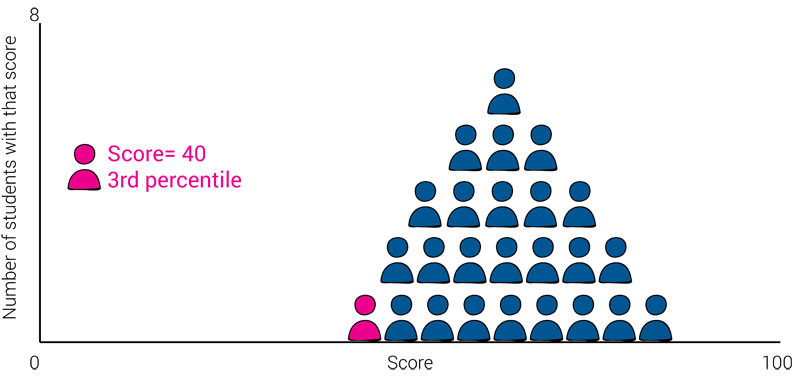
In the charts below, you can see that, while the student’s score doesn’t change, their percentile rank does change depending on how well the students in the norm group performed. When the individual is a top-performing student, they have a high percentile rank; when they are a low-performing student, they have a low percentile rank.
What we can’t tell from these charts is whether or not the student should be categorized as proficient or below proficient.
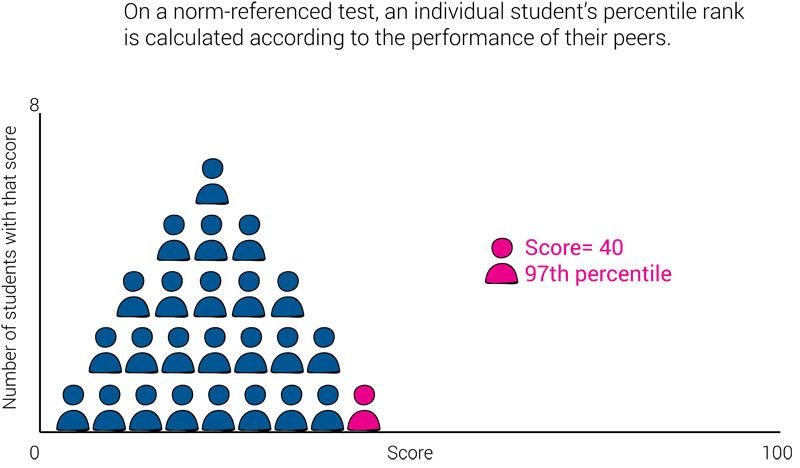
This means knowing a student’s percentile rank on a norm-referenced test will tell you how well that specific student performed compared to the performance of the norm group, but will not tell you whether the student met, exceeded, or fell short of proficiency or any other criterion.
The difference between norm-referenced scores and criterion-referenced scores
Some assessments provide both criterion-referenced and norm-referenced results, which can often be a source of confusion.
For example, you might have a student who has a high percentile rank, but doesn’t meet the criterion for proficiency. Is that student doing well, because they are outperforming their peers, or are they doing poorly, because they haven’t achieved proficiency?
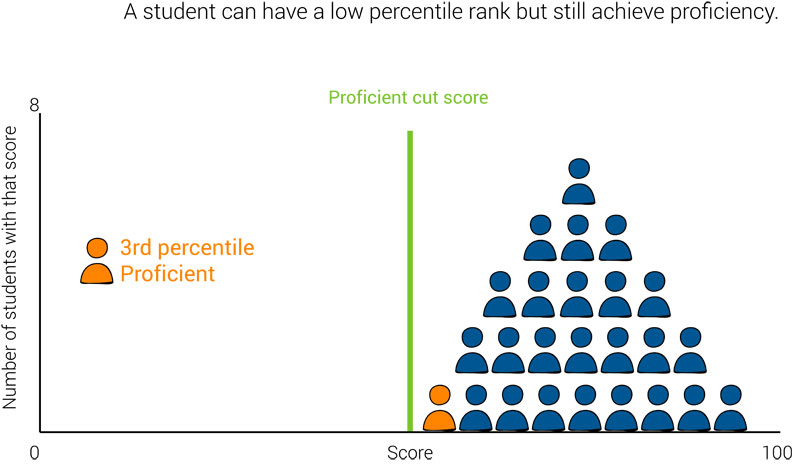
The opposite is also possible. A student could have a very low percentile rank, but still meet the criterion for proficiency. Is this student doing poorly, because they aren’t performing as well as their peers, or are they doing well, because they’ve achieved proficiency?
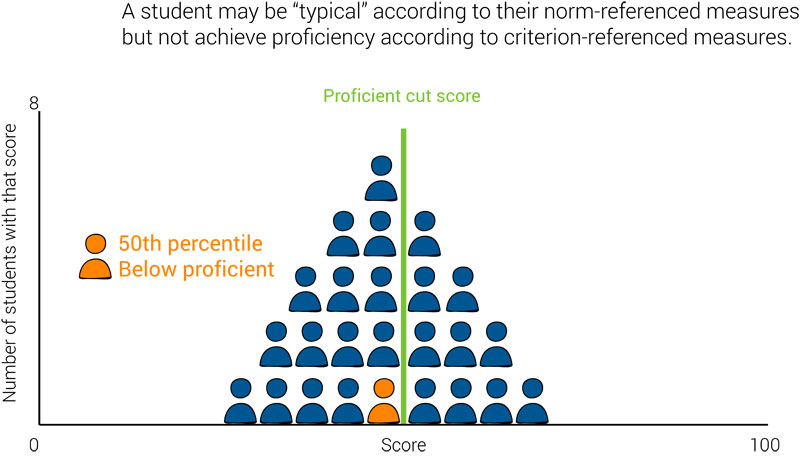
However, these are fairly extreme and rather unlikely cases. Perhaps more common is a “typical” or “average” student who does not achieve proficiency because the majority of students are not achieving proficiency.
In fact, this is the pattern we see with 2017 National Assessment of Educational Progress (NAEP) scores, where the “typical” fourth-grade student (50th percentile) has a score of 226 and the “average” fourth-grade student (average of all student scores) has a score of 222, but proficiency requires a score of 238 or higher.
In all of these cases, educators must use …
- Professional judgement
- Knowledge of the student
- Familiarity with standards and expectations
- Understanding of available resources, and
- Subject-area expertise
… to determine the best course of action for each individual student. The assessments—and the data they produce—merely provide information that the educator can use to help inform decisions.
Data to move learning forward
Discover assessments from Renaissance that help you to better identify and support each student’s needs.
Can a test provide both norm-referenced and criterion-referenced interpretations?
The short answer is “yes.” There are many instances of assessments that couple norm-referenced scores with criterion-referenced performance categories.
As an example, many universal screeners report both types of scores. Risk categories are often derived from empirical studies that use screener scores to predict a well-established outcome, such as the “proficient” classification on a state test. Universal screeners also report national percentile scores.
The combination of information makes universal screeners suitable for a variety of uses, including program evaluation and identifying students who need additional support—a point we’ll return to later in this blog.
What happened to Bruno?
So what happened to Bruno in the scenario described at the beginning of this post?
In the fall, Bruno scored 55 out of 100 on his district’s assessment. The district had set the cut-score for proficiency at 50, meaning that Bruno counts as “proficient.” The district’s assessment provider compared Bruno’s score of 55 to the fall scores of their norm group, and found that Bruno scored higher than 88% percent of his peers in the norming group. This gives him a percentile rank of 88.
In the spring, Bruno takes the same test again. This time he scores 60, higher than this fall score. Since the district’s criterion for proficiency hasn’t changed, he is still categorized as proficient.
Just like Bruno, students in the norm group took the assessment twice—once in the fall and once in the spring. This time, the district’s assessment provider compares Bruno’s spring score to the spring scores of the norm group.
In this case, the students in the norm group had notable gains and scored much higher in the spring than they did in the fall. Because students in the norm group generally had much larger gains from fall to spring than Bruno did, Bruno’s spring score now puts him at the 38th percentile.
For Bruno’s teacher, this is a sign of concern. Although Bruno is still categorized as proficient, he’s not keeping up with his peers and may be at risk of falling behind in future years. In addition, if the district or state raises the criterion for proficiency—which can happen when standards or assessments change—he might fall short of that new criterion and struggle to make enough gains in one year to meet more rigorous expectations.
This is one reason why it’s important for educators to monitor growth in addition to gains.
The importance of Student Growth Percentiles (SGP)
Gains are calculated by taking a student’s current score and simply subtracting their previous score. Gains indicate if a student has increased their knowledge or skill level, but do not indicate if a student is keeping up with their peers, surging ahead, or falling behind. For that, a growth measure is needed.
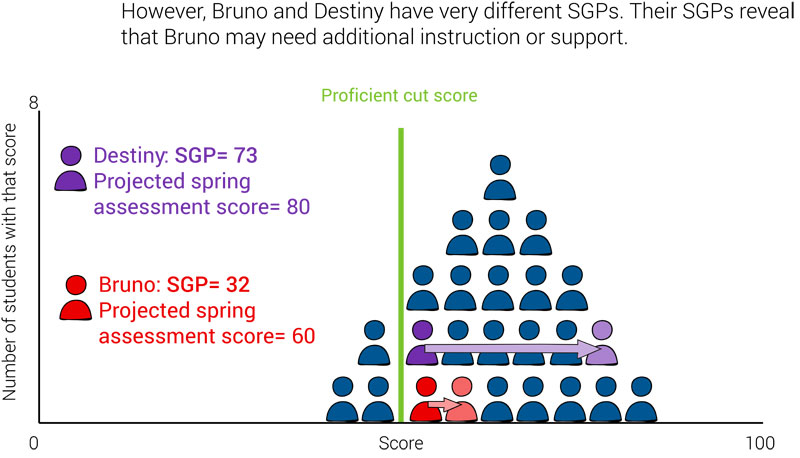
Growth—specifically a Student Growth Percentile or SGP—is a norm-referenced measure that compares a student’s gains from one period to another with the gains of their academic peers nationwide during a similar time span. Academic peers are defined as students in the same grade with a similar score history, which means low-performing students are compared to other low-performing students and high-performing students are compared to other high-performing students.
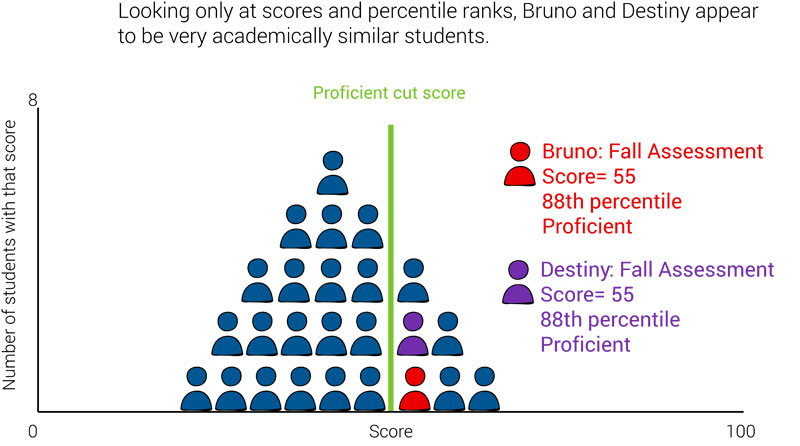
As a result, SGP helps educators quickly see if a student is making typical growth, or if they are growing much more quickly or much more slowly than their academic peers. SGP also allows teachers to see if two students with the same score are truly academically similar or if they actually have very different learning needs.
How knowing Bruno’s SGP could have improved his outcome
In Bruno’s case, knowing his SGP in the fall would have allowed his teacher to see that he has been making slower-than-expected growth. At this point, she could have proactively worked to boost his growth—perhaps by:
- Giving him additional practice opportunities
- Assigning him to a different instructional group
- Providing more targeted supports or scaffolding during lessons, or
- Pairing him with a higher-performing student for peer tutoring.
She might have also decided to assess him more frequently, perhaps every two or three months throughout the school year, to monitor his gains and growth more closely.
These efforts may have helped Bruno to end the school year the same way he started it—as a top-performing student—and be better prepared him for the challenges of the next grade.
Why consistency with SGP is key
SGP is only available after a student has taken the assessment in at least two different testing windows. In order to have an SGP in the fall, a student must have taken the assessment in a previous school year.
In addition, the SGP reported with a student’s fall assessment score would show…
- Spring-to-fall,
- Winter-to-fall, or
- Fall-to-fall
… growth from the last school year to the current school year, depending on when the student was last assessed. If that student then takes a midyear assessment in the winter, their updated SGP will reflect fall-to-winter growth for the current school year.
In all cases, SGP helps educators see trends in student learning and better predict future gains.
How norm-referenced assessment guides intervention
Now that we’ve considered student growth, let’s return to our earlier discussion of universal screeners. A norm-referenced assessment used in universal screening is designed to help you identify who needs extra support, who is on track, and who might benefit from accelerated instruction.
Because universal screeners are brief, they do not always tell you what support a student needs to get back on track. By combining different assessment data, however, you can create a detailed picture of which skills may need to be taught in order for students to become proficient. This data will also help you to determine if an intervention needs to occur:
- At the class level during whole group instruction (Tier 1 intervention)
- In a small group setting (Tier 2 intervention)
- Individually (Tier 3 intervention)
Let’s take a closer look at the role of norm-referenced assessment in universal screening and—for students who are placed in intervention—progress monitoring.
Norm-referenced assessment in universal screening
As noted earlier, the key goal of norm-referenced assessment is to identify how a student performed compared to others in a predetermined peer group. This helps indicate the level of risk, or need, of the student.
Universal screeners are norm-based assessments administered with the intent of identifying students who may be at risk for poor learning outcomes. This assessment is typically:
- Brief
- Reliable; and
- Valid
In universal screening, students from across the country (who are typically in the same grade) take an assessment. Educators can then analyze their scores to learn about their compared performance. For example:
- If a student’s score on a universal screener corresponds to the 75th national percentile, you know this student is performing at or above 75 percent of students in the national population. This is above the national average for the student’s current grade and season on that particular test.
- If another student’s score on the same test shows the 35th national percentile, you know this student is performing just below the national average for their grade level.
This information is important, so you know how much extra help a student needs to be considered “on-track” for success by the end of the school year.
The Renaissance solution for universal screening
Renaissance’s FastBridge and Star Assessments are norm-referenced universal screening solutions that offer both curriculum-based measures (CBMs) and computer-adaptive tests (CATs).
You can use FastBridge and Star to assess students in:
- Reading
- Math
- Social-emotional behavior
This combined approach improves reliability and validity of decisions by giving educators more accurate data about student learning—with results back faster than with any other system.
Norm-referenced assessment in progress monitoring
Another important goal of norm-referenced assessment is to regularly monitor a student’s progress in a particular area—typically weekly or biweekly. Progress monitoring tools are used to provide information about students who are participating in targeted Tier 2 and Tier 3 interventions.
Progress monitoring has three main objectives:
- To evaluate student learning outcomes: Tracking students over time will show if they have made expected gains with the provided intervention, as well as the additional gains needed to catch up to peers.
- To consider instructional change: Progress monitoring helps teachers to evaluate their own practices. A teacher can revise an intervention when progress data shows a student is not making gains.
- To determine eligibility for other educational services: Progress monitoring helps to determine if a student needs additional services and which services they may need, including special education services.
The Renaissance solution for progress monitoring
FastBridge and Star Assessments are also designed for progress monitoring. You can easily measure students’ rates of improvement, and you can also determine whether students are on-track to meet their goals. This helps you to determine whether each intervention should be…
- Maintained
- Modified; or
- Intensified
…to close gaps and help students catch up to expectations.
Criterion-referenced assessment and performance categories
As noted earlier, criterion-referenced scores compare a student’s knowledge or skills against a criterion. The criterion might be based on expert judgment of, say, proficiency, or it might be based on an external indicator, like performance on another well-established test.
State accountability assessments are typically considered criterion-referenced assessments because they report results as proficiency levels that were established through carefully designed protocols. These protocols generally use expert teacher judgment about what students ought to know and be able to do at the end of the grade.
Usually, the criterion is a single score or a few scores that result in several possible performance categories. Therefore, criterion-referenced results tell you whether a student met a standard, but not how far above or below the standard the student performed. Academic tests often use “cut scores” to place students into criterion-based categories, such as:
- Basic
- Proficient
- Advanced
Renaissance drives successful intervention with research-based assessments
To sum up, both norm-referenced and criterion-referenced scores are essential for gaining a complete picture of students’ performance and needs—and for helping to identify the best supports to move learning forward. If your school or district is looking for a complete solution for screening and progress monitoring for pre-K through grade 12, Renaissance can help.
Connect with an expert today to get started.