May 29, 2020
Note: This is the third in a series of blogs on using your assessment data to address learning gaps during the 2020–2021 school year.
It’s shockingly quiet in most school buildings these days. The constant sound of voices and the continual movement of students and staff going from place to place have largely been replaced by silence. If we’re lucky, these conditions allow for a little more reflection than usual. If we take a few moments to envision and prepare for the potential academic realities we’ll face in the new school year, we’ll be a lot better off. As we noted in our first blog, multiple predictions about Back-to-School (BTS) 2020 have already been published. Will we see the dire “COVID-19 Slide” that some have predicted? If so, how significant will this slide be?
The authors of one recent analysis made some alarming predictions, based on the typical “summer slide” (Kuhfeld and Tarasawa, 2020). However, findings about the impact of summer learning loss actually vary widely. Koury (2019) noted that “the recent research on summer learning loss is quite mixed, with some studies showing significant loss and others finding little evidence” (emphasis added). Indeed, one of the authors of the aforementioned analysis acknowledged in 2018 that “there are significant gaps in our research about summer learning loss” (Kuhfeld, 2018).
This raises a further question: To what extent do recent school closures truly reflect the dynamics of a typical summer? During a typical summer, the majority of students are off from school and are not necessarily engaged in learning activities of any kind. During COVID-19, the majority of students have had learning continue in some form, whether online or with printed packets provided by their schools.
Another author recently mused about the potential academic impacts of COVID-19 by looking at longitudinal performance data around long-term school closures in Argentina, which were caused by extensive teacher strikes in the 1980s and 1990s (Barnum, 2020). The amount of time students were away from school had some parallels to recent events, but the context does not. The researcher who originally analyzed the Argentinian data echoes an idea we noted above, explaining that conclusions likely cannot be drawn because “the situation today is much different,” as schools “have online learning” that “would at least mute part of the negative results” (Jaume cited in Barnum, 2020).
Educational heroes of the COVID-19 era
In some ways, the dire decline in student performance that some have projected unintentionally belittles the tremendous efforts that so many educators have put forth to pivot to different learning activities. And this has been no small feat. Most schools have had an “all-hands-on-deck” sense of urgency to make sure that learning continues, despite the sudden school closures. During the spring of 2020, a massive amount of schoolwork was completed, often via distance learning, and social media feeds are rife with evidence that many parents are also actively involved in keeping things going for their children academically. There are even conversations about making this summer more academic than most.
It’s been a century since the last global pandemic. During this time, technology has transformed the world almost beyond recognition. We have more ways to support remote learning than ever before, and educators have made the most of these resources over the last few months to make this transition a reality. They are clearly among the heroes of the COVID-19 response.
An all-important first step
Let’s return to the dire predictions we discussed earlier. In a broad sense, the core of these predications is accurate: We will likely see lower test scores and a wider variance in scores when the new school year begins this fall. However, the magnitude of the impact is the primary unknown. There does not appear to be a viable way to predict the scale of the decline or the range of score variability with any degree of reliability.
Ultimately, however, these predictions do not matter. They will not change the realities we’ll face in the next academic year. Let’s not spend too much time wringing our hands over dire predictions; instead, let’s “control what we can control” and make plans for using our assessment data to guide teaching and learning in the new school year.
An excellent first step that school leaders can take right now is getting their hands firmly around their “baselines” for student proficiency and growth. In other words, take the time now to gather data you can use to compare performance during the more-typical BTS 2019 with the anything-but-typical BTS 2020. Before we can fully understand the new realities of the 2020–2021 school year, we must have a firm grasp of how things were going before the disruptions. These are our baselines.
Identifying metrics to compare
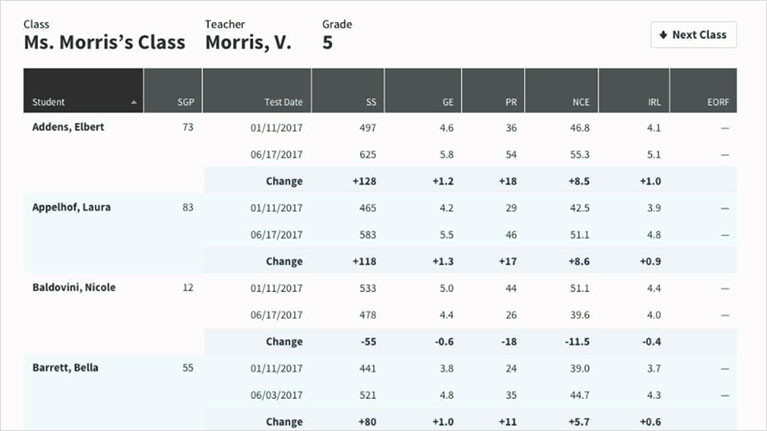
Most districts have key metrics on which they rely to make decisions and drive instruction, and there are valid reasons for using various scores. Some use Percentile Rank (PR) scores, while others favor Student Growth Percentile (SGP), Normal Curve Equivalent (NCE), Instructional Reading Level (IRL), Lexile level, Quantile measure, Grade Equivalent (GE), or—more likely—a combination of these.
Other districts may be less sure of which scores to consult. For those seeking guidance, we suggest that you have scores that provide each of the following:
- A normative reference
- A proficiency-based reference
- A growth reference
Some type of normative reference is critical because it provides a position within a national sample. While many districts gravitate toward Percentile Rank (PR) because it’s considered intuitive, we’re suggesting the use of the Normal Curve Equivalent (NCE) score. This is a norm-referenced score similar to PR. The two scores are presented and interpreted quite similarly (both have a range of 1 to 99); the key difference is that NCE scores are based on an equal interval scale. This means that the difference between any two successive scores has the same meaning throughout the scale (e.g., 1 to 2, 49 to 50, 98 to 99, etc.).
NCE scores are particularly useful in making comparisons between different achievement tests and for statistical computations, such as determining an average score for a group of students. Depending on how scores are distributed, PRs could over- or understate any losses/gains, based on where students fall within the overall distribution. The equal-interval nature of NCE scores prevents this.
Another helpful reference is a proficiency-based score. Given that Star Assessments are statistically linked to most high-stakes tests, many of our customers use benchmarks tied to their state test performance levels when they view Star Screening Reports. Those reports, then, reflect data through the lens of likely performance on the eventual summative test, and they provide estimates of the number of students who fall above or below proficiency, as defined by the state.
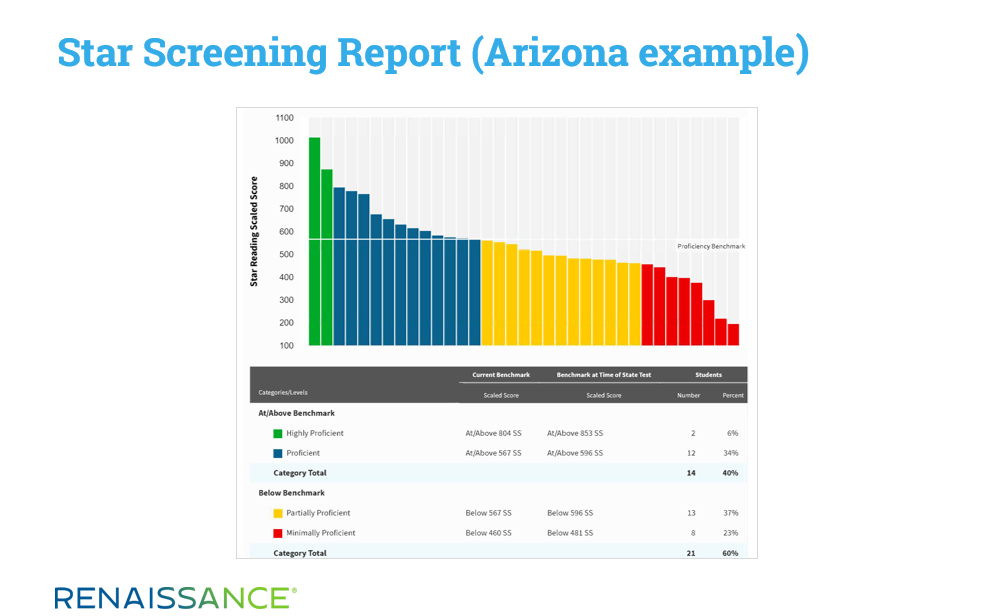
Proficiency-based scores, which frame things through the lens of a school’s or district’s own students in relation to a criterion-based assessment, add an element not provided by normative scores. While an observation such as “we saw a 6-point drop in the average NCE score among incoming sixth graders” provides a helpful norm-referenced perspective, the proficiency-based score can provide additional insight, such as “we now have 32 more students falling below benchmark.”
Finally, it’s also important to have a reliable growth reference. Historically, many schools used a pre-test/post-test model, which is easily accommodated by Star’s Growth Report. But with the advent of Student Growth Percentile (SGP) scores—which are also clearly displayed on the Growth Report—many now look to this metric instead. SGP scores consider additional elements (e.g., the phenomenon of “regression to the mean,” comparing students to their true “academic peers,” etc.) that are not considered in a pre-test/post-test model, resulting in a more comprehensive measurement of student growth.
Ensuring educational equity
Once you’ve identified the metrics that are representative of overall performance, the final step, if at all possible, is to disaggregate your data to check for any variances in performance by student subgroup. Many authors have suggested that our most disadvantaged students will be disproportionately impacted by the COVID-19-related school closures. In analyzing your data, you might find, for example, only a small dip in scores overall, but a more significant decrease for Free/Reduced Lunch students or for EL/ESL students. Understanding performance across subgroups is critical for ensuring equity.
Depending on how your Renaissance site was set up, you may or may not have imported the demographic information necessary to disaggregate scores by subgroup. The customization fields within Star reports support disaggregation when this demographic data is available.
Outside of Star, data platforms like Schoolzilla greatly facilitate this process.
Resources for getting started
So, how can you most effectively gather baseline data? We’ve created a Gather Insights from Star Assessments worksheet to help you identify the data you want to collect as a baseline for later comparison. We’ve also created two videos—one for teachers and principals, and the other for district administrators—that show you how to access and work with the relevant Star reports.
See where teachers and principals can access key metrics in Star

See where district administrators can access key metrics in Star
Of course, getting your baselines will help you prepare to meet students’ academic needs during the new school year. In the next blog in this series, we’ll discuss another critical component of planning for BTS 2020: the social-emotional aspect of student learning.
References
Barnum, M. (2020). The coronavirus double whammy: School closures, economic downturn could derail student learning, research shows. Retrieved from: https://www.chalkbeat.org/2020/3/24/21196123/the-coronavirus-double-whammy-school-closures-economic-downturn-could-derail-student-learning-resear
Koury, A. (2019). Do kids really lose their school learning during summer break? A researcher finds mostly not. Retrieved from: https://www.washingtonpost.com/health/do-kids-really-lose-their-school-learning-during-summer-break-a-researcher-finds-mostly-not/2019/08/02/207bf9d2-ac8c-11e9-8e77-03b30bc29f64_story.html
Kuhfeld, M. (2018). Summer learning loss: What we know and what we’re learning. Retrieved from: https://www.nwea.org/blog/2018/summer-learning-loss-what-we-know-what-were-learning/
Kuhfeld, M., and Tarasawa, B. (2020). The COVID-19 slide: What summer learning loss can tell us about the potential impact of school closures on student academic achievement. Retrieved from: https://www.nwea.org/content/uploads/2020/05/Collaborative-Brief_Covid19-Slide-APR20.pdf
How can insights from social-emotional learning support your assessment plans? Get the answer in the next blog in this series, along with tips for embedding SEL in daily instruction.