
May 14, 2021
By Amanda Beckler, Senior Research Analyst, David Butz, Senior Research Analyst
In the new Winter Edition of our How Kids Are Performing report, we estimate the lingering impacts of the pandemic on student performance in reading and math through the middle of the 2020–2021 school year. Results are presented in a variety of metrics, including Scaled Scores, Percentile Ranks, and estimated weeks of instruction. The report uses aggregated data from millions of students who took Renaissance’s Star Reading and Star Math assessments in both Fall 2020 and Winter 2020–2021.
In this blog, we’ll estimate the pandemic’s impact using another metric—likely performance on spring state summative exams. This is a timely topic, given that many states are administering their exams in March, April, and May of 2021 for the first time since 2019. As we document in How Kids Are Performing, many educators and other stakeholders have noticed lower-than-usual performance this year as a result of the pandemic and the many challenges it has brought to education. Consequently, many are wondering what to expect from their state test results.
This is an especially challenging question because the population of students expected to take statewide standardized tests in 2021 is anticipated to be smaller and potentially systematically different than students who tested in Spring 2019, making year-over-year comparisons impossible. As such, we hope this analysis provides a helpful national context for local and state leaders as they interpret their own results.
Quantifying the pandemic’s impact on student performance
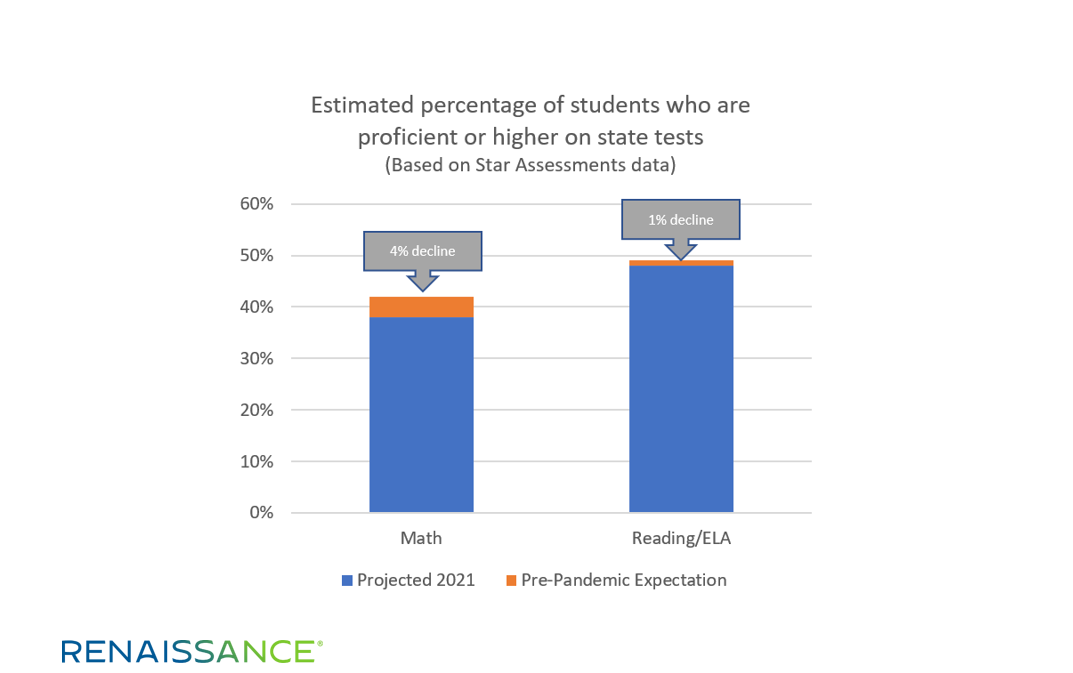
Consistent with the How Kids Are Performing findings, we estimate a small negative impact on state reading performance and a larger negative impact on math performance. More specifically, we estimate that the pandemic will result in an overall decline of about 1 percent in the percentage of students who will reach proficient status or higher on their state reading/ELA test. We estimate the impact on math will be an overall decline of about 4 percent in the percentage of students who will reach proficient status or higher on state math tests. The two grades where math achievement is likely to be most negatively impacted are grades 4 and 5, where we anticipate that 9 percent and 6 percent fewer students will reach proficiency due to the pandemic, respectively. Impacts at other grade levels are smaller.
How are we able to estimate state test outcomes? First, Star Reading and Star Math scales have been statistically linked to state end-of-year test scales. Evaluations of those linkages indicate that Star correlates strongly with state assessments and predicts results with a high degree of accuracy.1 In other words, we can use Star test results from fall and winter to reliably estimate whether students are likely to meet their state’s standard for proficiency in reading and math in the spring, long before official state results are released.2
Second, because the How Kids Are Performing analysis also includes student-level estimates of how each student would be performing this year had the pandemic not occurred, we can also project that value to the date of each student’s state test, as shown in the graphic below.
Study sample size and considerations
This analysis includes a subset of students from the Winter Edition of How Kids Are Performing, restricted by grade level and state.3 It focuses on grades 3–8, which are the grades that states are mandated to assess. States were included if we felt we had a sufficiently large sample as well as a current linking study between Star and the state test. In total, this analysis included 1,701,098 students from 33 states in reading and 1,085,652 students from 35 states in math.
Any research project has limitations, and there are a few to note with this analysis. First, the growth norms we used to project students within-year are from pre-COVID school years and may not reflect actual student growth patterns during 2020–2021. However, it is worth noting that fall to winter growth from 2020–2021, as documented in How Kids Are Performing, approached typical pre-COVID levels in both reading and math. Therefore, there is reason to expect these growth norms might accurately project the remainder of the school year.
Second, there will always be some degree of imprecision in using performance on one test (in this case, Star) to predict performance on another (state summative exams). That said, Star has an extensive track record of predicting state summative results with high, though not perfect, accuracy. Technical reports from each Star-state linking study can be found by searching our research library. Each state linking study includes accuracy results, correlations, sample sizes, and other details.
Finally, this analysis is limited to students who took Star and met other sampling requirements. We do not claim to have a fully representative sample of students from the US or from any individual state. Similarly, we realize that some students have not been participating in schooling during the pandemic, and our sample may be systematically excluding certain types of students. The results might differ if we were able to involve a larger sample of students. Like the state summative tests administered in 2021, our data provide one piece of information in understanding a larger educational picture.
Addressing learning loss this summer—and beyond
In a recent blog, our colleague Dr. Gene Kerns pointed out that the academic recovery from COVID-19 will have more in common with a marathon than a sprint. In that spirit, we’d like to conclude with three actionable “next steps” for educators and education leaders.
First, take advantage of summer learning opportunities and extended school-day/extended school-year programs to help make up “lost ground” due to the pandemic. Second, use our Renaissance Focus Skills for reading and math to help prioritize the most critical content at each grade level. Finally, remember the important role of your interim assessment tools for answering essential questions about students’ instructional needs—and for tracking your district’s progress in reversing the academic impacts of COVID-19.
Notes
1 Star Reading and Star Math meet the highest standard of evidence for classification accuracy (being able to predict important outcomes later in the school year), as judged by the independent National Center on Intensive Intervention’s Academic Screening Review. See Star’s reviews by clicking here.
2 Note that proficiency means different things in different states—for two reasons. First, in some states, “proficient” is set at a considerably more challenging level of performance than in other states. Second, although every state has a set proficiency benchmark on its test that indicates meeting grade-level state performance standards, the language states use to explain that level of performance is inconsistent. For example, in Florida, the desired proficiency level is called “Level 3.” In Wisconsin, it’s called “Proficient,” and in Massachusetts, “Meeting Expectations.” For this study, we connected Star to each state’s specific proficiency level that represents meeting state grade-level performance standards.
3 See the report for more details about the study.
If you haven’t already, download the new Winter Edition of How Kids Are Performing for more insights on student performance and growth this year. To access the report and supporting resources, click the button below.