


February 19, 2015
The 2014–15 school year brings unprecedented change in summative assessment. More than 80 percent of US students will sit for a new assessment, whether it’s from The Partnership for Assessment of Readiness for College and Careers (PARCC), the Smarter Balanced Assessment Consortium (SBAC), or a more traditional provider.
Perhaps more significantly, pass rates are projected to be less than 50 percent. While PARCC has yet to set cut scores or make any projections, SBAC has set cut scores based on last year’s pilot and forecasts pass rates ranging from a low of 32 percent (Grade 8 Mathematics) to a high of 44 percent (Grade 5 ELA/Literacy). Attempts to raise standards are inextricably linked to drops in proficiency rates, but the forthcoming test results will cause many schools to face public inquiries about why scores have dropped.
While it is easy to adopt an attitude that “the sky is falling,” it should be noted that this situation is not entirely new. Previous state tests have been changed in the past, as have the cut scores within them. That said, the shifts we are about to encounter are unprecedented. At a time when there is so much pressure on schools and so much tension around testing and Common Core itself, how are school leaders to face the pending public inquiry?
In this time of flux, the assessments in Renaissance Star Assessments have remained a stable growth measure for many schools, and the data from them can be quite useful when it comes to ensuring stakeholders that all is not lost. While results from mandated summative assessments may create a perception that, overnight, many schools have gone from good to bad, Star assessments can help document a trend of continual improvement.
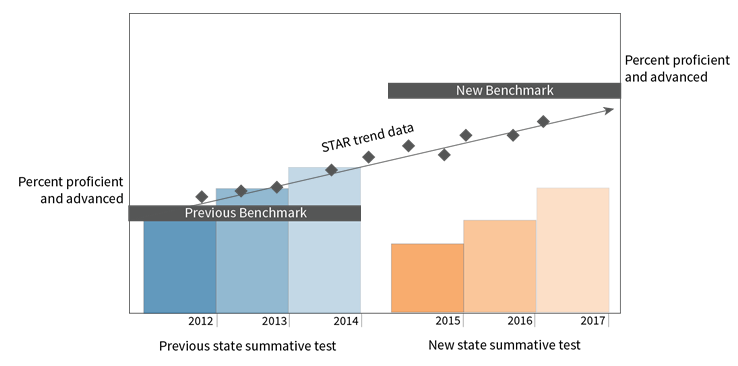
The graph above is an example of the kind of evidence of ongoing growth educators can create with reliable and valid, longitudinal Star 360 data. Placed in the context of the apparent drop in proficiency rates we expect to see with new summative assessments and higher benchmarks, this is a powerful and necessary image that will help educators demonstrate that students are indeed growing.
School leaders would be well served to consult two particular data sets within Star 360. First, for schools that truly have been steadily improving, Longitudinal Reports in Star 360 can easily document this by showing proficiency rates against benchmarks that are fixed, unlike the changing benchmarks of the summative tests. When a school leader can show ever-increasing proficiency rates, many fears will be allayed.
Secondly, Star assessments include Student Growth Percentile scores (SGPs), which offer insight into relative growth. If, for example, a school has an average SGP of 62, that would indicate that its students are demonstrating growth equal to or greater than the growth seen in 62 percent of their academic peers nationwide (students in the same grade and nearly the same starting score).
Increasing proficiency and above-normal growth can both be documented through Star 360 scores, and both can be used to bring confidence to stakeholders and calm amidst changing state tests. In addition, Star 360 provides multiple other benefits at the interim level, providing detailed information for instructional planning through our Core Progress learning progression, the exact information teachers need to help students reach the raised bar of performance. Finally, after the results are back from this first year of new summative tests, linking studies will allow us to project performance on both SBAC and PARCC tests with a high degree of accuracy, providing an additional level of insight.
Learn more
To learn more about the power of Renaissance Star Assessments, click the button below.