
September 18, 2014
This month we’re launching the first phase of Learnalytics®, a website designed to leverage Renaissance’s massive databases and to provide insights into what students know, what they like, and how they learn. We are so pleased to share what we’ve learned from working closely with educators for three decades and mining billions of data points.
When I first arrived at Renaissance ten years ago, fresh from a stint as an analyst with a research firm, I was impressed with the amount of educational data we had at our fingertips. Back then, school districts would send the Renaissance Research Department their reading and mathematics data, and, in turn, we’d help them analyze and make sense of their results.
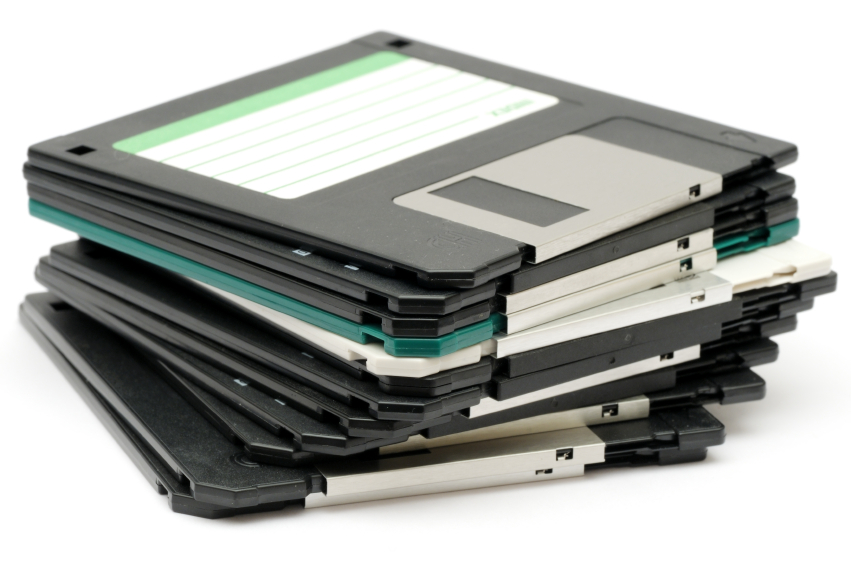
Sometimes they’d transmit files electronically. Other times they would mail us CD-ROMs or diskettes. (Remember those?)
Working with districts to interpret their data, we quickly recognized that the information—once stripped of identifying information and aggregated—could be used to address big questions about achievement, in particular the role that daily reading or math practice plays in influencing growth. We were excited to build research files with as many as 50,000 students. Such large and rich data sets were rare back then, but our co-founder and leader, Terry Paul, was ahead of his time. He was adamant that we use this resource to gain insights about how students learn and to improve education. Digging into the data yielded a number of papers, journal articles, and conference presentations.
To say that times have changed is an understatement.
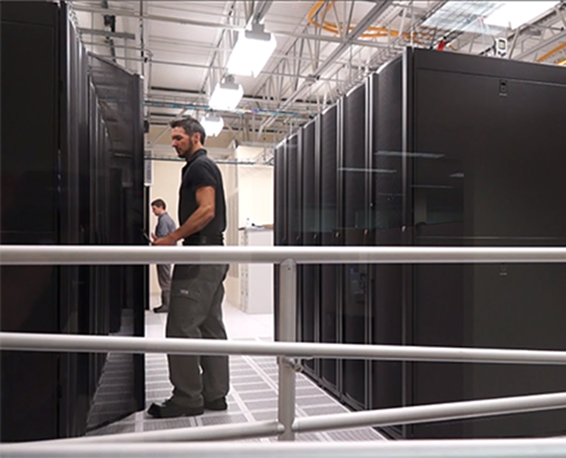
For one, the technology is much more powerful and efficient. Long gone are the days of transmitting data via CD-ROM or diskette. And the scope is massive. Every week, millions of records flow into secure server rooms in Wisconsin Rapids, Wisconsin. Last year alone, students using Renaissance products took 57 million Star achievement assessments, mastered nearly 30 million math objectives, and read 350 million books.
Those servers now contain billions of pieces of information spanning several school years and representing all 50 states, Canada, and the United Kingdom.
Educational data of this magnitude is a necessity, but it is not sufficient for realizing the promise of “learning analytics” a concept that has been defined as the “measurement, collection, analysis and reporting of data about learners and their contexts, for purposes of understanding and optimising learning and the environments in which it occurs” (Siemens, 2010). And grappling with data is only one aspect of this exciting field; we must also know which questions are worth addressing and whether the information provided to educators and students is actionable.
Though not new, learning analytics as a field is still young and evolving. Recent developments make its promise clearer and more apparent, but if learning analytics were a baseball game, we’d barely be out of the first inning. Education, in general, is lagging behind other fields such as medicine in terms of using “big data” to better understand problems, discover solutions, and create highly personalized experiences. Luckily, there are ample opportunities to learn from those fields about new analytic techniques and how information should be managed and protected.
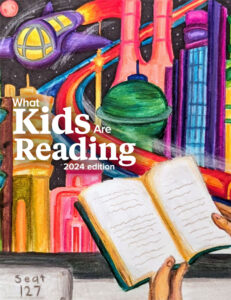
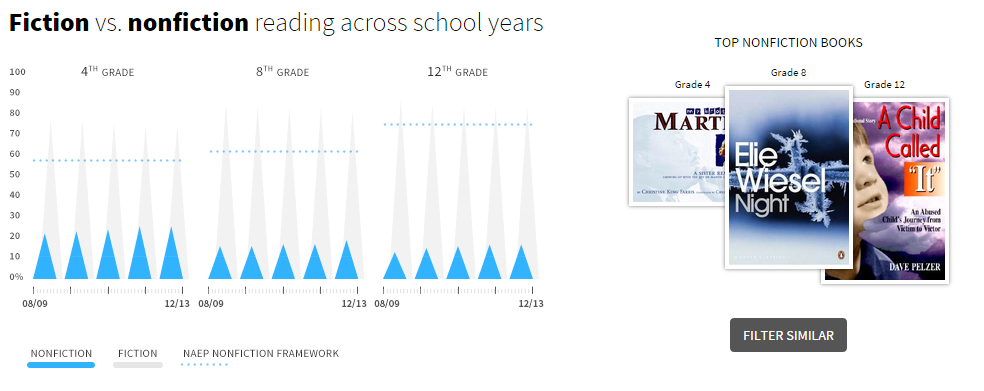
In this first launch phase, our Learnalytics® site will focus on some intriguing, interactive book-reading data. For years, we have released our annual What Kids Are Reading reports, which celebrate popular books in K–12. Educators and parents alike find the report a trusty reference of oft-read books nationwide that helps to encourage reading practice and guide students to books they might enjoy. The What Kids Are Reading tool on Learnalytics® allows you to explore book-reading data in much greater detail than a static report allows. You can generate your own personalized list and then save it as a PDF or share it with friends. Want to find out which nonfiction books are read most often in Texas by fifth-grade boys? Or what books are popular among Colorado students reading at a high interest level (grades 6 and up) but who need less challenging text (grade 3–4 difficulty level)? The site invites highly customized searches like these and makes it easy to “dive into” the data.
And stay tuned. . . . In the near future Learnalytics® will allow users to explore learning progressions, understand patterns of achievement and growth, and much more.
Having data plus the tools to turn it into relevant information makes this an exciting time in education. We hope that Learnalytics becomes a way for us to share what we’re learning about learning and how to accelerate it.
References
Siemens, G. (2010). 1st International Conference on Learning Analytics and Knowledge 2011 call for papers. Retrieved from https://tekri.athabascau.ca/analytics/call-papers
Learn more about Learnalytics® and What Kids Are Reading!
About the author

Eric Stickney
Eric Stickney is Senior Director of Educational Research at Renaissance. He specializes in analyzing reading and mathematics data collected from millions of students in the US and around the world.